Do you know how effective your Instagram marketing is? Are you aware of how it interacts with your overall marketing efforts?
Could you tell me how many people clicked on your profile link to get to your site, or how many people messaged you for more information?
If you don’t know the answers to these questions, you should.
And, even better, you can find these answers easily without a lot of effort or needing to spend a penny.
All of this information is available to you through Instagram analytics program, Insights.
While it’s not quite as in-depth as Facebook’s Insights just yet, there’s so much you can learn.
In this post, we’ll go over all things Instagram Analytics, including what you can learn on the native platform, how to apply it to improve your marketing, and if you should use any third party analytics tools for more data.
First of all, let’s answer a basic question:
Do All Profiles Have Analytics?
Officially, the Insights feature is only available to business profiles.
That being said, any Instagram profile can be converted into a business profile, so if you don’t have access to Insights now, you can soon.
If you’re not sure, you can see how to convert to a business profile here.
Where to Find Instagram Analytics
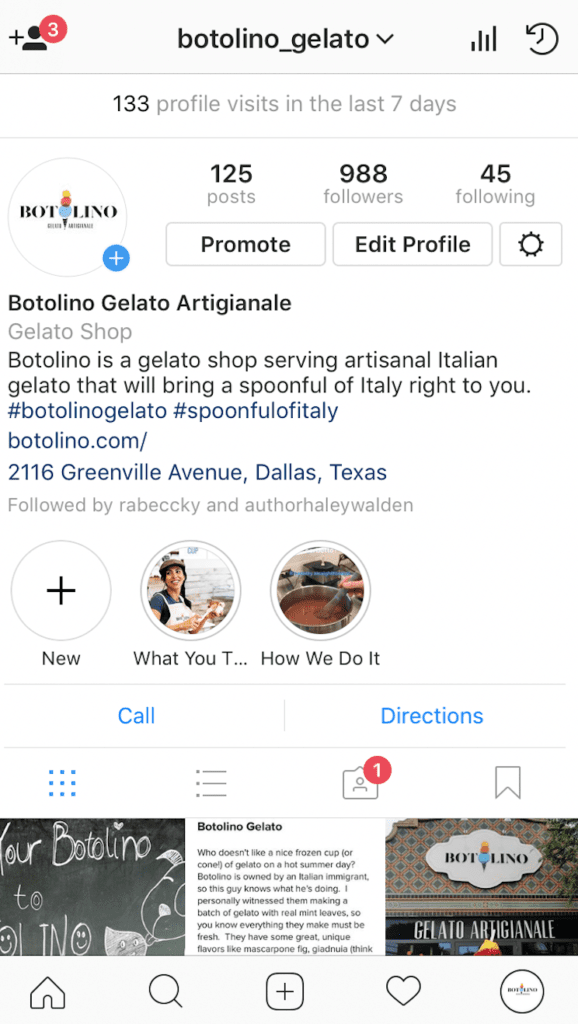
When viewing your home page, you’ll see a black graph symbol in the top right-hand corner.
Click on that, and you’ll be taken right to Instagram’s Insights.
What You Can Learn from Instagram Analytics
We got the two easiest questions out of the way, so now it’s time to take a close look at what exactly we can learn from Instagram Insights, and how we can apply that knowledge.
To keep it simple, we’re going to break it down into the three tabs that Insights currently has available: Activity, Content, and Audience.
Instagram Insights – Activity
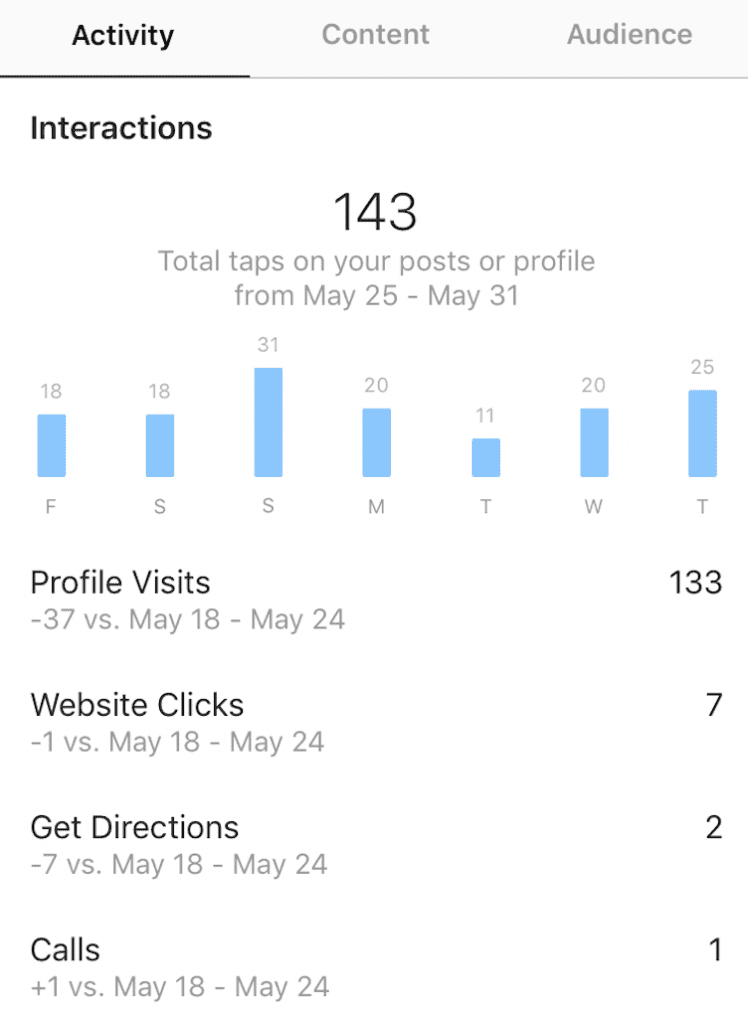
The activity tab shows you key stats on how your profile overall is performing on Instagram.
This is the place where you’ll be able to assess that your content is not only popular, but effective at driving real customer actions.
Here, you can learn:
- How many “profile visits” your profile has received within the past week
- The total number of “taps” your profile or its posts have received in the past week
- How many “website clicks” users made from your profile in the last week
- The number of “get directions” or phone calls users placed through your Instagram profile
As you can see from the images above, you’ll not only be able to see the data in the current period, but also how it’s performing compared to recent past weeks.
They’ll also give you some insight into when most of these interactions happened so you can look for peak posting times, or trends as it relates to your content.
If you noticed, for example, that you had no posts on Tuesday and it got the least number of interactions, it may signal to start posting daily.
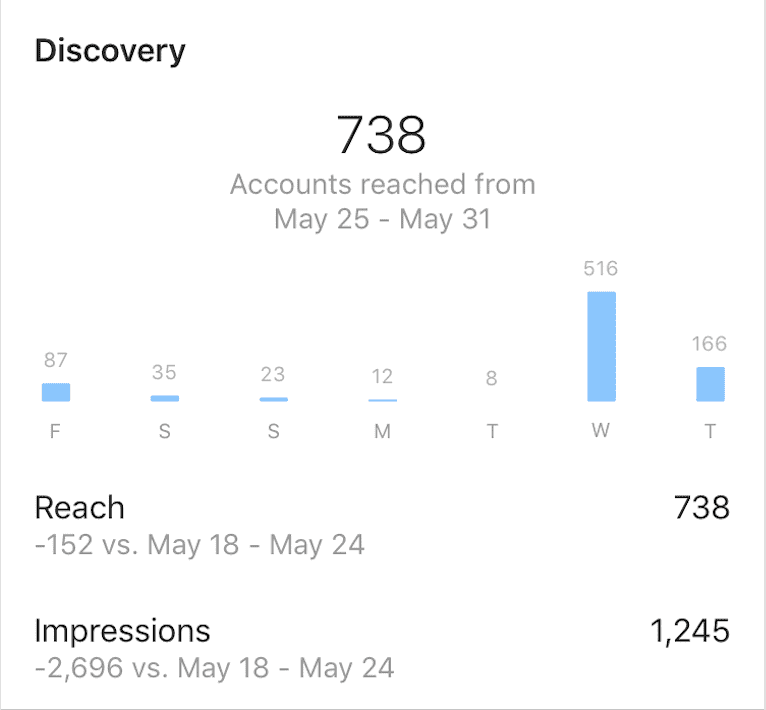
Underneath this, you’ll also see the Discovery section, which tells you how effective your content was at reaching your followers.
You’ll see when you were most effective at reaching users, and your reach (total number of unique accounts that saw your posts) and impressions (the total number of views on your posts).
The discovery section can help you evaluate how effective your growth and discovery strategies are.
If you see a surge on the day of a particular post, you can look at its content, hashtags, and whether or not it tagged influencers to get a more solid idea of which strategies were most helpful to you.
This is the best way to determine not only how engaging your content is, but how your strategies to boost reach are working.
This is a crucial difference that a lot of businesses overlook.
Instagram Insights – Content
This tab will give you all the information about how specific posts are performing, making it easier to quickly see which are getting the most engagement and what type of results they’re getting.
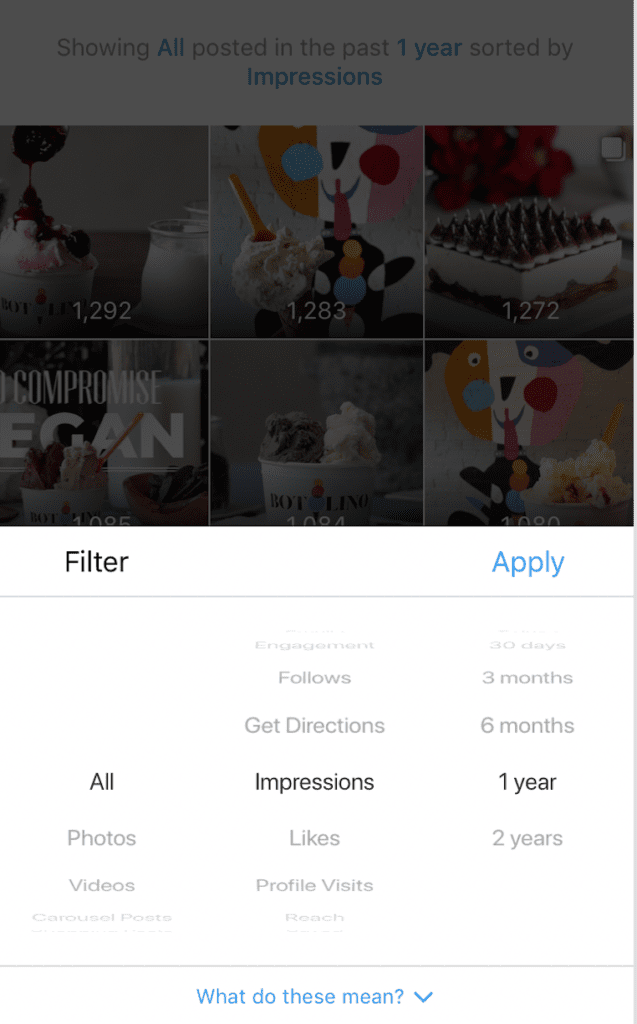
When you first click to view all Feed Posts, you’ll see at the top that they’re sorted by Impressions.
The content with the most impressions is at the top.
You can change this to see top performing posts by actions driven, including the following:
- Calls
- Comments
- Emails
- Engagements
- Follows
- Get Directions
- Impressions
- Likes
- Profile Visits
- Reach
- Saved
- Texts
- Website clicks
If you want to get really specific, you can choose to filter by photos, videos, carousel posts, and shopping posts to better track what’s working for each individual type of post.
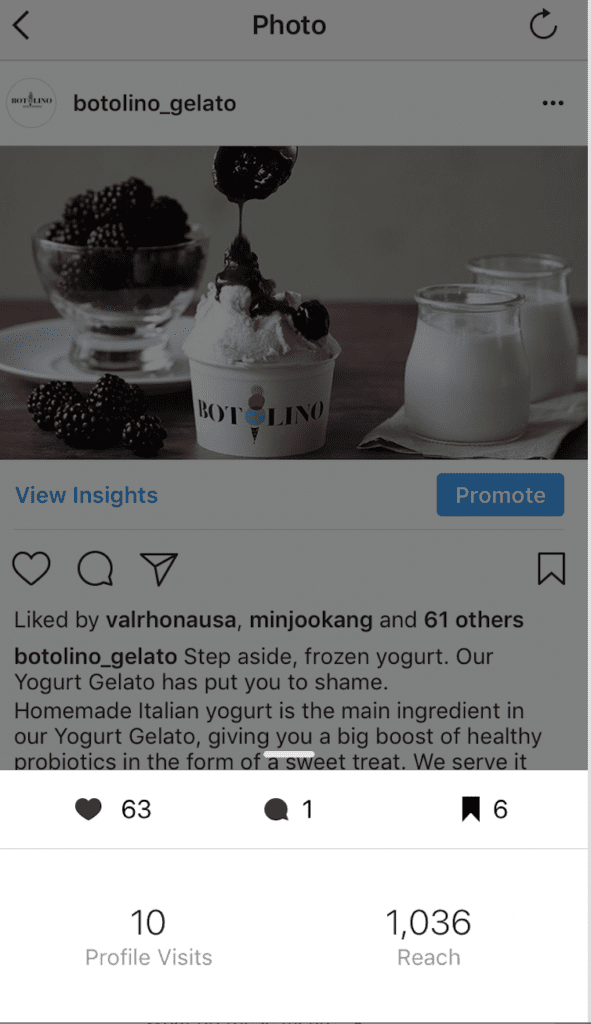
You can also click on an individual post to see its stats in detail.
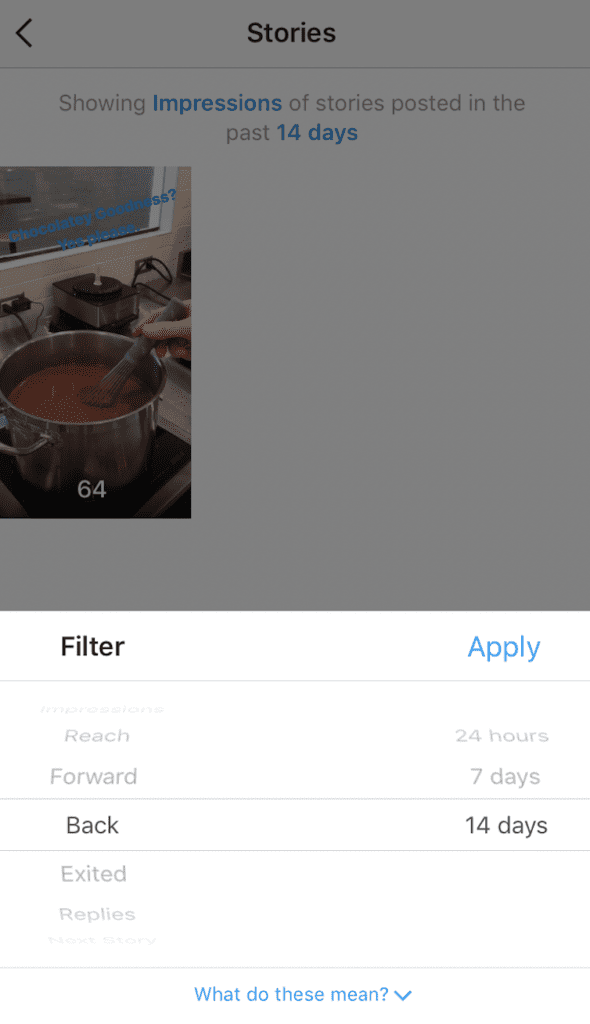
Under this tab, you’ll also find information on Instagram Stories.
Note that there isn’t a ton of analytic data available here unless you go looking.
Also important: you can only see “Instagram Stories” data as far back as 14 days, so make sure you’re watching it closely and recording the data, or it’ll be gone.
Under this section, you can see the following based on the past fourteen days, seven days, or 24 hours:
- Impressions
- Reach
- Forward
- Back
- Exited early
- Replies
- Next Story
After reviewing your top 10 posts with the best reach, maybe you’ll notice that they each had a #haircutsfordays hashtag attached, or you’ll see that posts with the most link clicks and calls had #Seattlefood attached.
Instagram Insights – Audience
Instagram doesn’t have nearly as much information about its users as Facebook does on its own, but they’re still able to give us the most important stuff under the Audience tab in Insights.
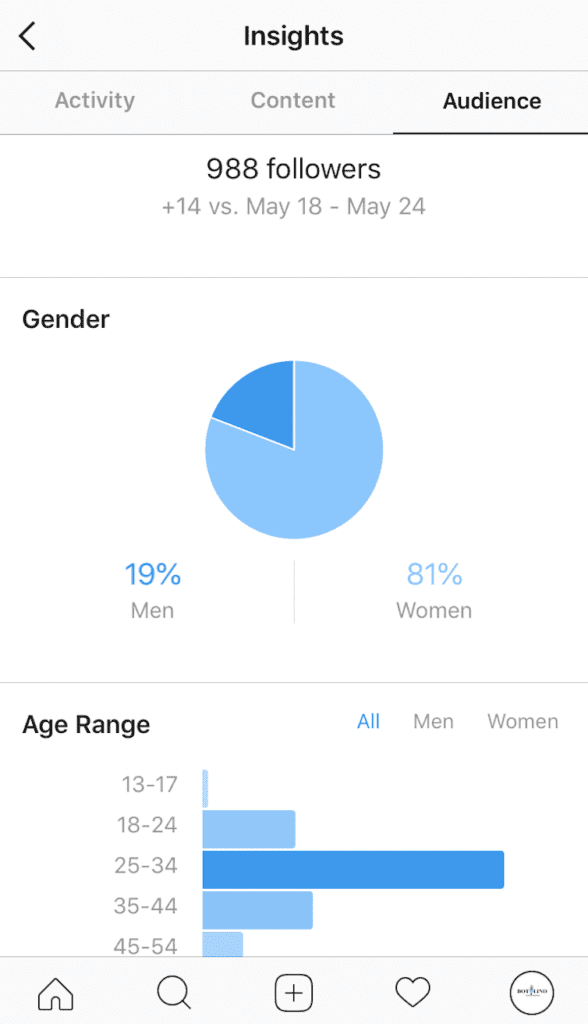
You’ll be able to track follower growth and learn more about your individual user base.
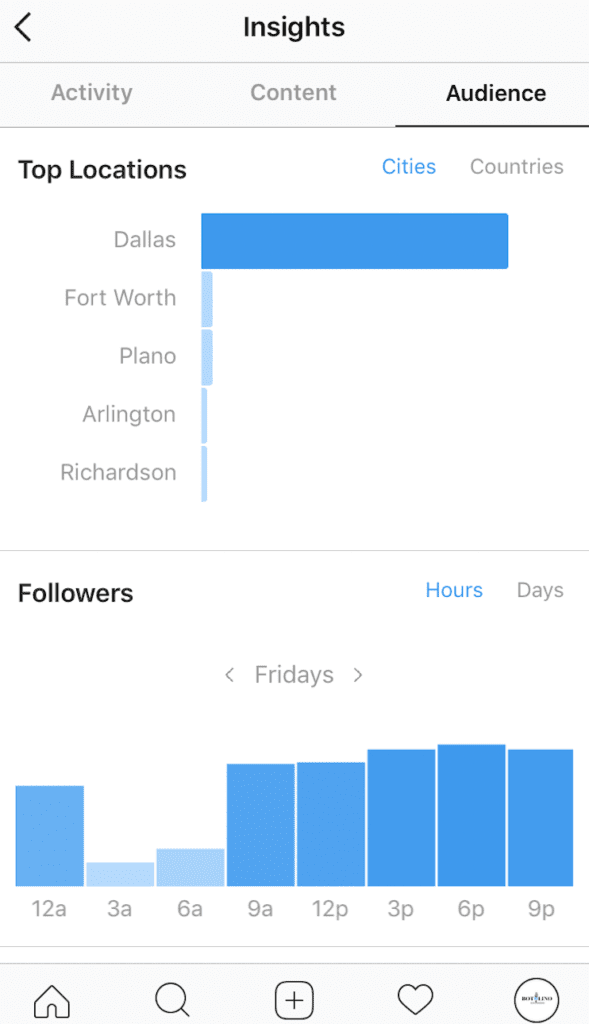
First, you’ll be able to see which Cities and Countries are giving you the most followers, the ages of your followers, and what percentage of men and women you have following you.
My favorite part of the audience analytics, however, is found at the very bottom of this tab.
It shows you when your followers are online, by day and by the hour.
Fridays at 3AM are clearly not the time to post, though Fridays overall look good.
This can help you determine what time you want your posts to go live to increase the likelihood that users will see it and engage with it.
What About Third-Party Instagram Analytics Tools?
If you want a tool that’s 1) available through desktop and 2) goes into a little more detail, you should take a look into third-party analytics tools.
There are a lot of really great ones out there, but when it comes down to it, there are two I can happily recommend for our wonderful AdEspresso readers: Hootsuite and Snaplytics.
The former will give you analytics on feed content, and the latter will provide outstanding Stories analytics.
Let’s take a quick look at both.
Hootsuite
Hootsuite is an outstanding social media management and analytics tool. While it has a lot of great features (like the ability to more easily manage and publish content on social media), my favorite aspect has always been the detailed analytics.
Hootsuite will give you a lot more in-depth information than Instagram Insights does.
You can see information like reactions to posts according to audience demographics, language spoken, or gender, or specific actions taken by followers.
Even better: Hootsuite’s data goes a lot farther back than Instagram’s native Insights, so you can see big-picture stuff and measure your KPIs and progress more effectively.
You can see more about their Analytics information here:
Snaplytics
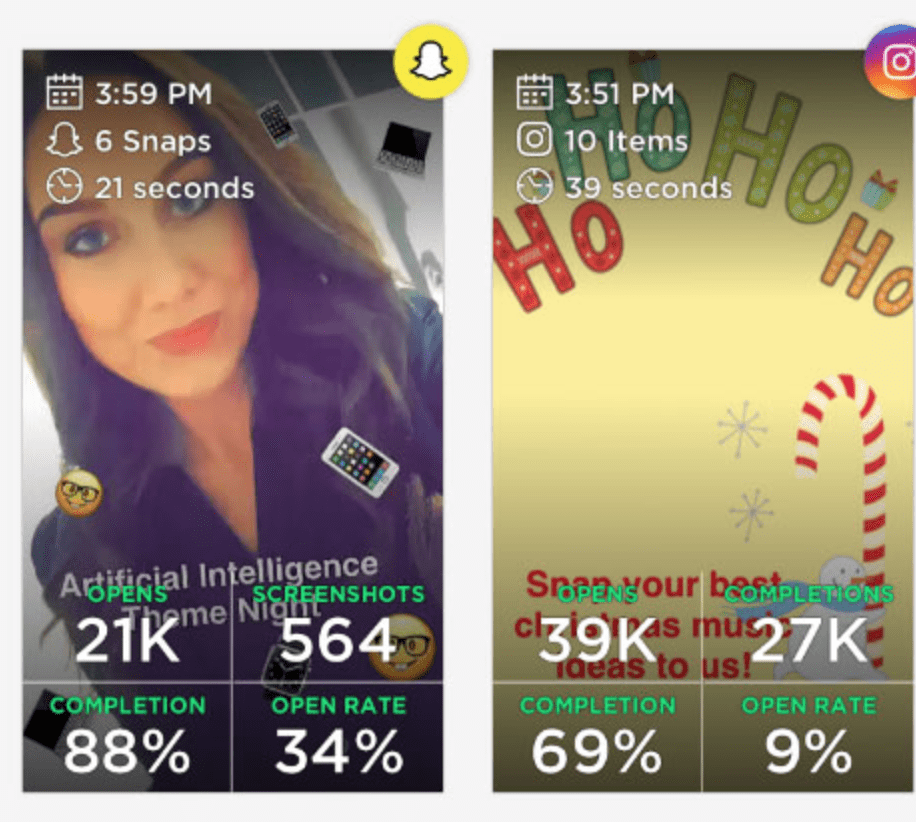
Snaplytics-– as you may have guessed from the name– is an Analytics platform that was originally created for Snapchat. (If you happen to need a Snapchat analytics tool, for whatever it’s worth, choose this one.)
They have extended their offerings to now include Instagram Stories analytics, too.
You can see additional Stories information, like Story completion rate, open rate, and the total number of each.
And, like Hootsuite, their paid plans can take you back further than just a few weeks, so you’ll be able to accurately track trends and get a better understanding of what’s working.
Final Thoughts
Instagram Analytics don’t have to be complicated thanks to the incredibly straight-forward tools that are available to businesses.
Whether you decide to stick to Instagram’s free native Insights or use third-party analytics tools like Hootsuite or Snaplytics, you’ll be in good hands as long as you regularly monitor the campaigns and actively apply the insights you’ve gained from them.
What do you think? How do you use Instagram Analytics to improve your marketing? Do you use the native platform or a third party tool? Share your thoughts and questions in the comments below!
Nice Informations. Thanks for sharing great tools.
It’s good to know the new tools. Analytics is much easier.
How do you recommend instagram for direct selling? Thanks
Wonderful informations
Hey, great post!
I think this is a good start for anyone who’s into the whole “analytics” thing, however I think you’re able to get deeper and better understanding of your Instagram, followers etc, by using some of the 3. party software you can “plugin” to your Instagram Business account.
Thanks!
Hello, every time i use to check website posts here in the early hours in the morning,
because i love to gain knowledge of more and more.
Hi there Ana. I just read your article about Instagram Analytics, have you tried EvoIg ? I would love to hear your opinion about this Instagram Analytics Tool. Thanks
I am a professional blogger, and I value Instagram a lot.
Great information. You can also check the link below for the more information.
You have nicely explained about viewing our Instagram account stats. Thanks for this article.