The Beginner's Guide to Facebook Advertising
Chapter 7
Facebook Ads Reporting: How to Track Performance
You do the research, create your Facebook ad campaign, wait for the results and…nothing happens. The impressions don’t come, the leads don’t materialize and the sales aren’t shooting sky-high. No matter how hard you try, this will happen to you eventually, and that’s why you need to be familiar with reporting: tracking, adjusting and learning from your campaigns.
In this final chapter of our Facebook advertising guide, we’ll teach you how to:
- Find data on your current and past Facebook campaigns.
- Use columns and campaign breakdowns to dig deep into the metrics that matter to you.
- Send yourself automatic reports on your current campaigns.
- Save time with reporting on AdEspresso.
Reporting is what will turn you from a beginner at Facebook ads into an expert. No matter how amazing your campaigns are, you need to monitor them throughout their lifetime so that you can learn how to make them better — and improve your future campaigns.
Facebook ads reporting in the Ads Manager
The easiest way to review the data from your ad campaigns is in the Facebook Ads Manager. This is where you can measure the performance of every ad you run.
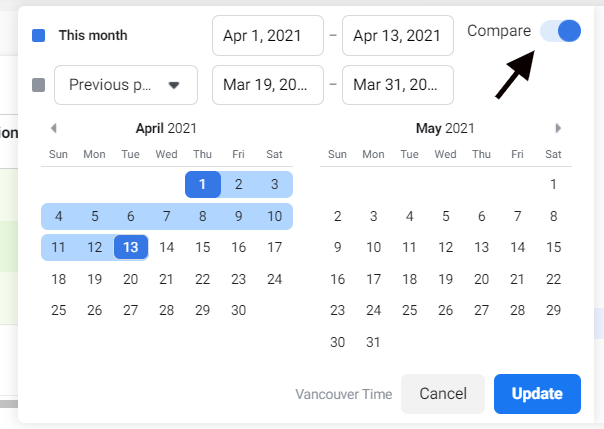
Once you start running campaigns, you should start to see the results fill in each column on your dashboard. If you want to see the recent performance of a campaign, filter for only the last seven days with the date selector in the top-right corner. You can also use the date selector to compare two different time periods by toggling Compare, so you can see how your campaign performance has changed over time.
Although the default settings in Ads Manager should give you a good overview of how things are going with your campaigns, you can go a lot deeper with some simple changes and views.
Manage data with ad report columns
Depending on your goals, you can customize the Ads Manager’s columns to hide the data you don’t need and highlight what is important to you.
By default, your Ads Manager table should include:
- Budget: The type of budget your campaign is using
- Attribution settings: The set period of time that Facebook will attribute conversions to this particular ad campaign.
- Results: How many times your campaign has successfully completed its objective, whether that’s conversions, impressions, likes, etc.
- Reach: The number of unique people who saw your ad
- Impressions: The total number of times your ad was displayed on a screen (including second, third, fourth, etc., views by a person)
- Cost per result: How much you’ve spent on this ad campaign compared to how many results it has generated
- Amount spent: The total amount of money you have spent on this ad campaign
- Ends: When your ad campaign is scheduled to finish
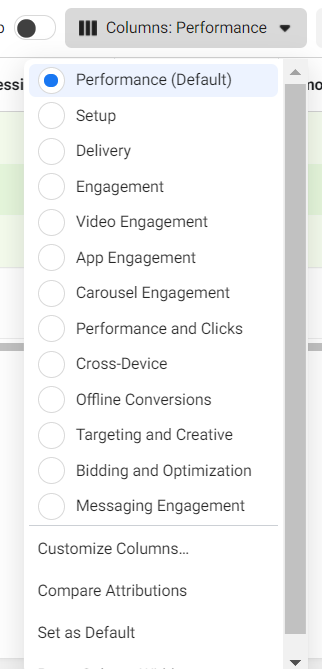
To edit these columns, just click on the Columns drop-down menu in the Ads Manager’s top-right corner.
After clicking on Columns, you will be given a list of options to choose from, including a list of preset options that can help you find the metrics you need, depending on your goals. For example, with campaigns focused on driving people to your brick-and-mortar store, you could choose Offline Conversions to see metrics like offline purchases, offline leads, and cost per purchase.
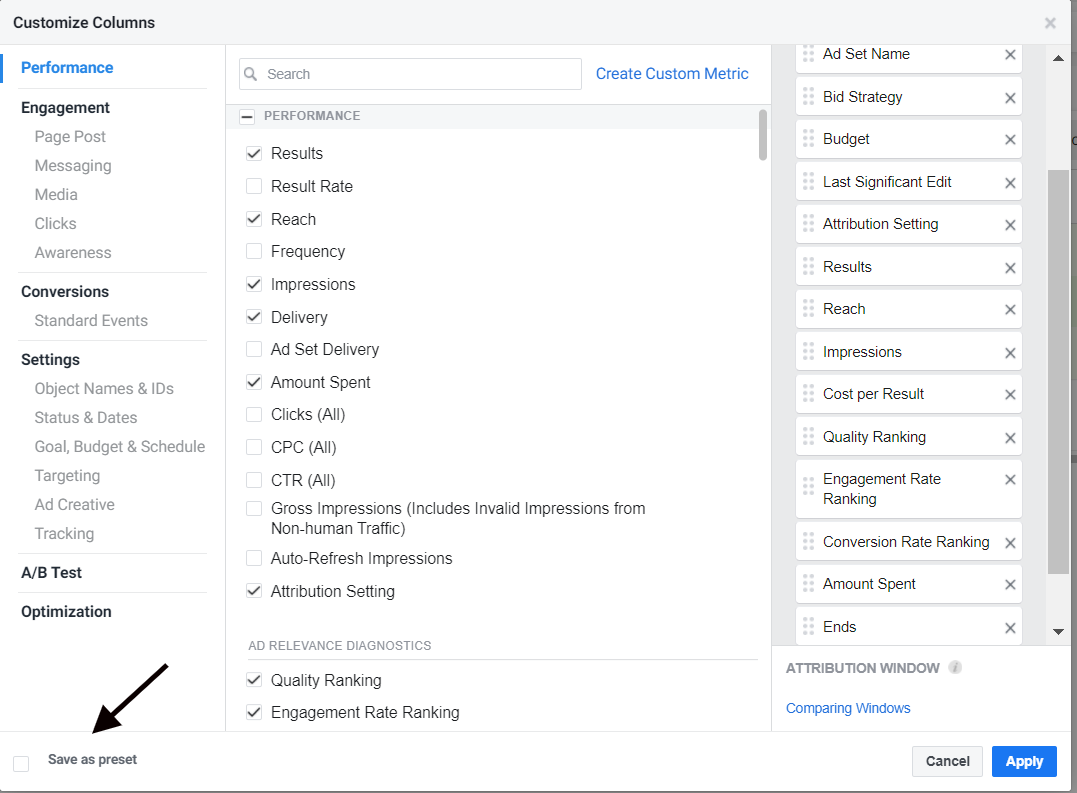
If none of the presets work, you can also customize the columns yourself by clicking on Customize Columns.
Once you have selected the columns you want, you can even save your custom configuration as a preset so that you can come back to it whenever you need to.
You can learn more about ad metrics and how to choose the ones that will help your campaign succeed by reading The Simple Guide to Understand Facebook Ads Metrics.
Use advanced reports with campaign breakdown
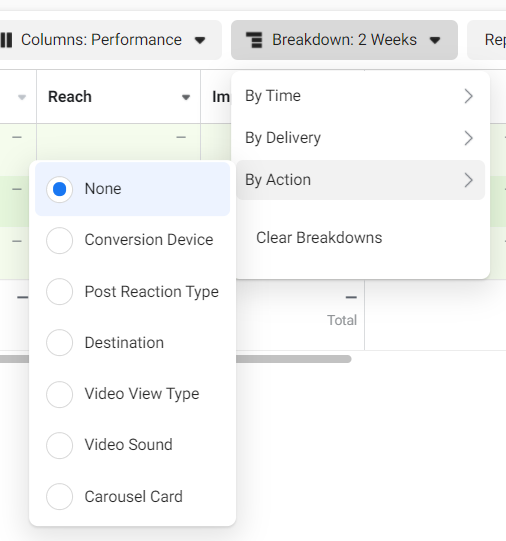
The Ads Manager’s Breakdown menu lets you go beyond basic metrics by allowing you to see your data’s specific subsets. These subsets are categorized into three main groups:
- Delivery: Who was the ad delivered to and how was it delivered.
- Action: What actions people took during and after their interaction with your ad.
- Time: Sort ad data by time increments of days, weeks, two weeks, or months.
Within each group, you have multiple options. At any one time, you can have one breakdown from each of the categories active to get even more in-depth into your data.
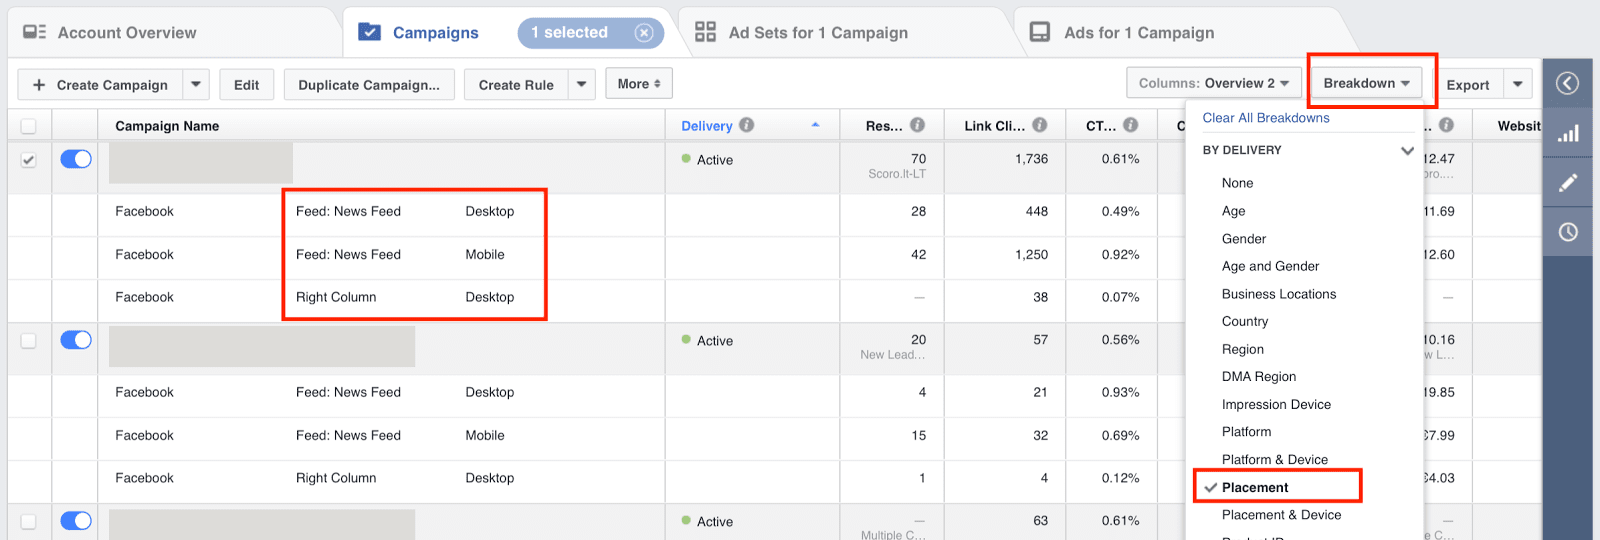
Toggling different breakdowns can give you insights into the individual components of your campaigns. For example, in the image below, we’ve broken down our ad campaigns by placement, allowing us to find all of the poorly performing placements so that we can turn them off in favor of better-performing placements.
If your ad campaign is using multiple ad creatives, placements or post timings, break the view down according to these independent variables to see which variations are getting you the results you want. Zero in on underperforming portions of your ad strategy so that you can learn for future ads and optimize current ones for what is working best.
Save and automate campaign reports
To make your life easier, you can have Facebook automatically email your reports directly to your inbox.
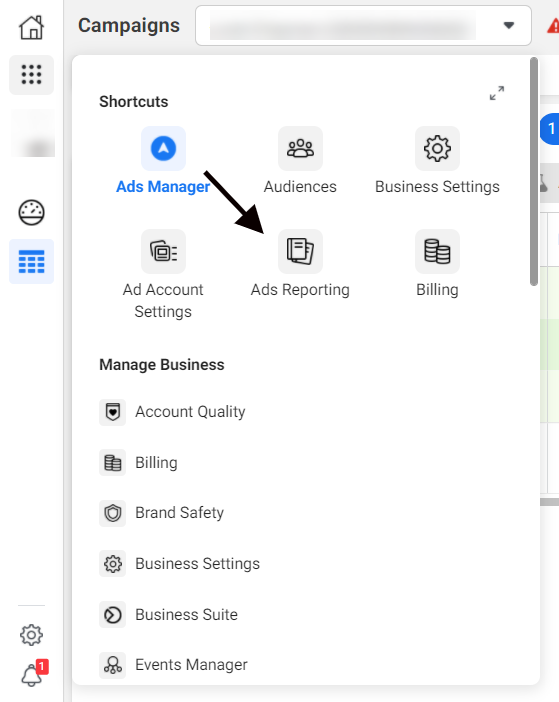
To set up a report, click on the three-dot icon in the top-left corner and select Ads Reporting.
Next, click on Create Report and choose the kind of report you would like to make (pivot table, trend line chart or bar chart). You can always change the chart type afterward.
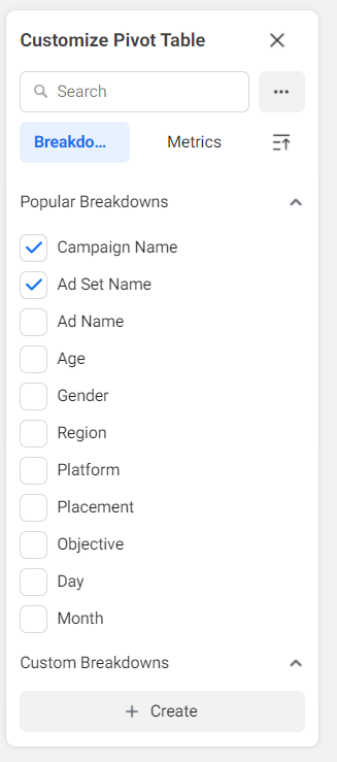
Use the bar on the right to make the report your own by adding the metrics you want to see included in your custom report.
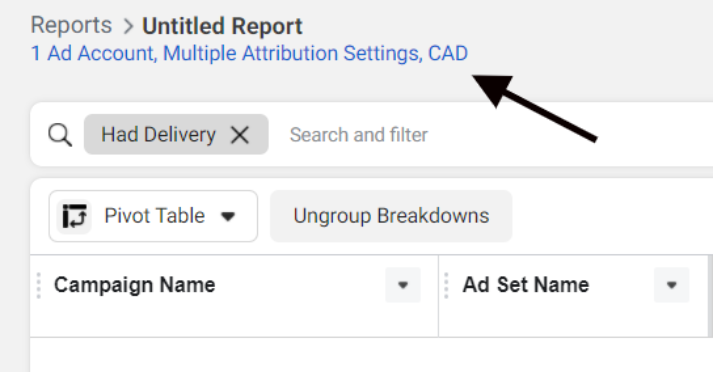
When you have the report the way you want it, click on the blue hyperlink in the top-left corner. Your hyperlink may look different depending on your country and how many ad accounts you are reporting on.
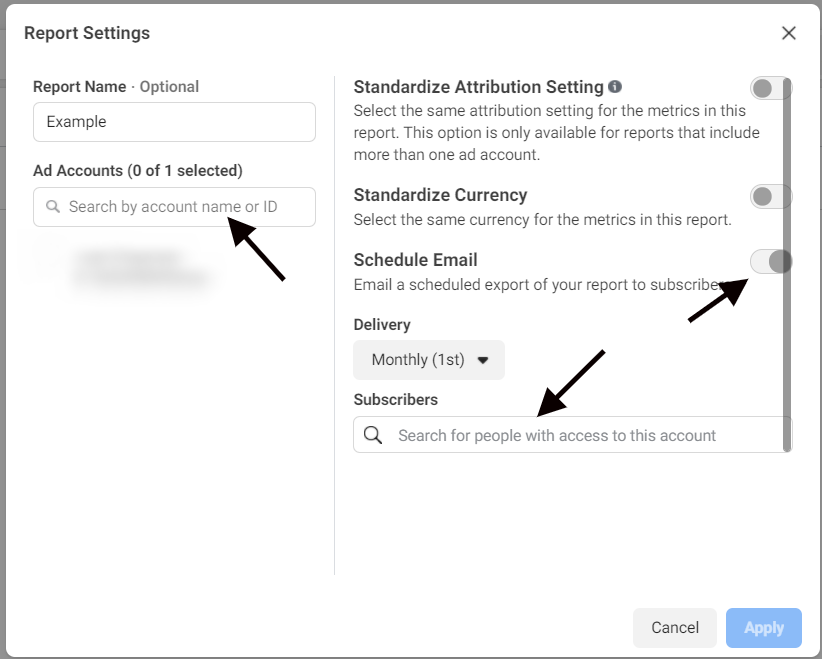
In the next window, you’ll need to select the associated ad accounts, toggle on Schedule Email, choose the delivery frequency, and then add subscribers from the people who have access to the account.
With a recurring reporting set up, you can expect to get automatic reports sent to you, so you never forget to check on your ad campaigns again.
Generate your reports with AdEspresso
If you’re using AdEspresso to manage your Facebook ad campaigns, you can take advantage of a number of advanced reporting options.
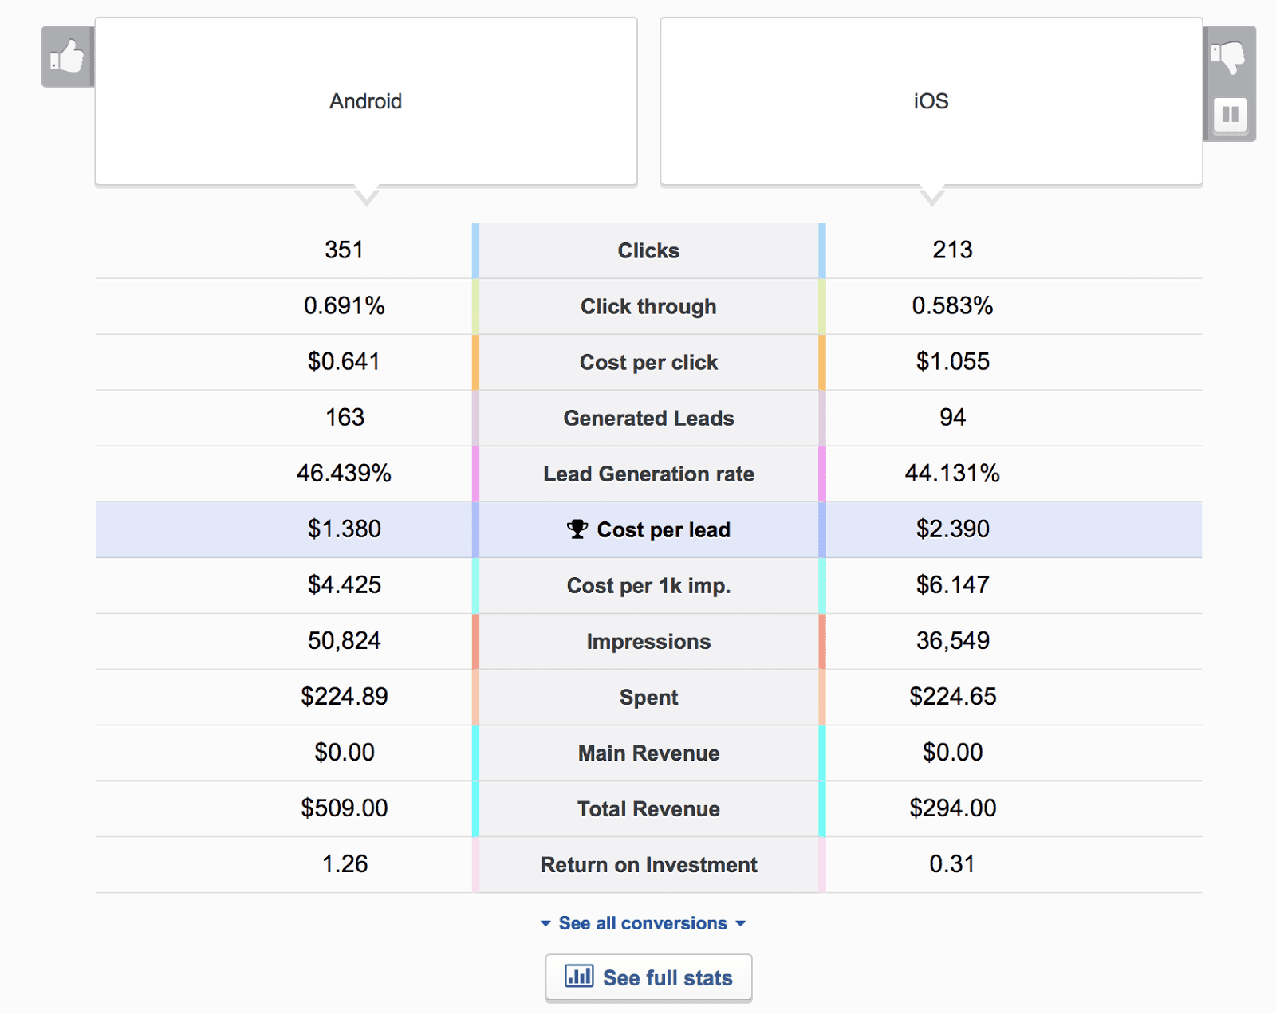
This includes visual data to show you your A/B test results, so you can optimize your current campaign for maximum results.
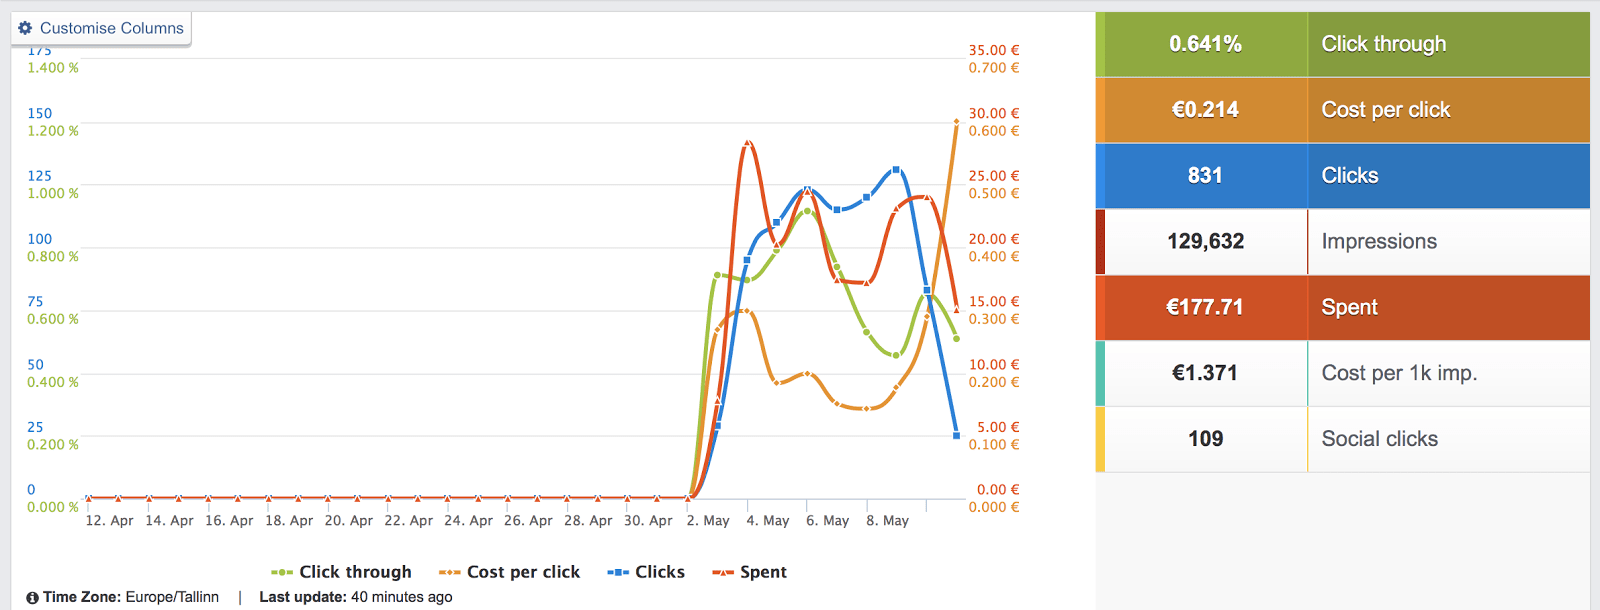
With AdEspresso, you can also create beautiful PDF reports to be shared with your team, your clients or whoever needs them.
In just a few clicks, you can have a beautiful report ready to show up in your inbox whenever you see fit.
Once you check the preview of your report, you can configure your delivery to be sent to specific email addresses or to be generated from AdEspresso and emailed to you. We’ll take care of generating the report every day, week, or month with your latest results ready for your perusal in your inbox.
Your next steps with Facebook advertising
Remember, in online marketing, there’s no one-size-fits-all method. Always test your theories and continue to connect with your audiences. You need to apply what you learn and keep testing everything, never assuming that something will work just because you’ve read it online.
Also, every business is different. While there are many tips and best practices we can teach you, only you know how your business works, who your customers are, and how to effectively apply what you’ve learned here.
Advertising on Facebook is always changing as Facebook features, audiences, and algorithms evolve over time. If you want to stay ahead of the crowd, take a look at some of the resources on our blog that will help guide you in the latest best practices on Facebook.


